Reporting and Logging
Kasm offers built in reporting and logging dashboards. The logging settings can be changed in the Settings dashboard and more information on those can be found Here.
By default the logs are retained for one week which would be the maximum amount of time to see the reporting in the dashboard and logs.
For large production deployments, it is recommended that administators utilize an external logging / SIEM solution and ingest Kasm’s File Based Logs.
Dashboard
The reports show the last day of data by default but can be changed by the Time Period dropdown menu.
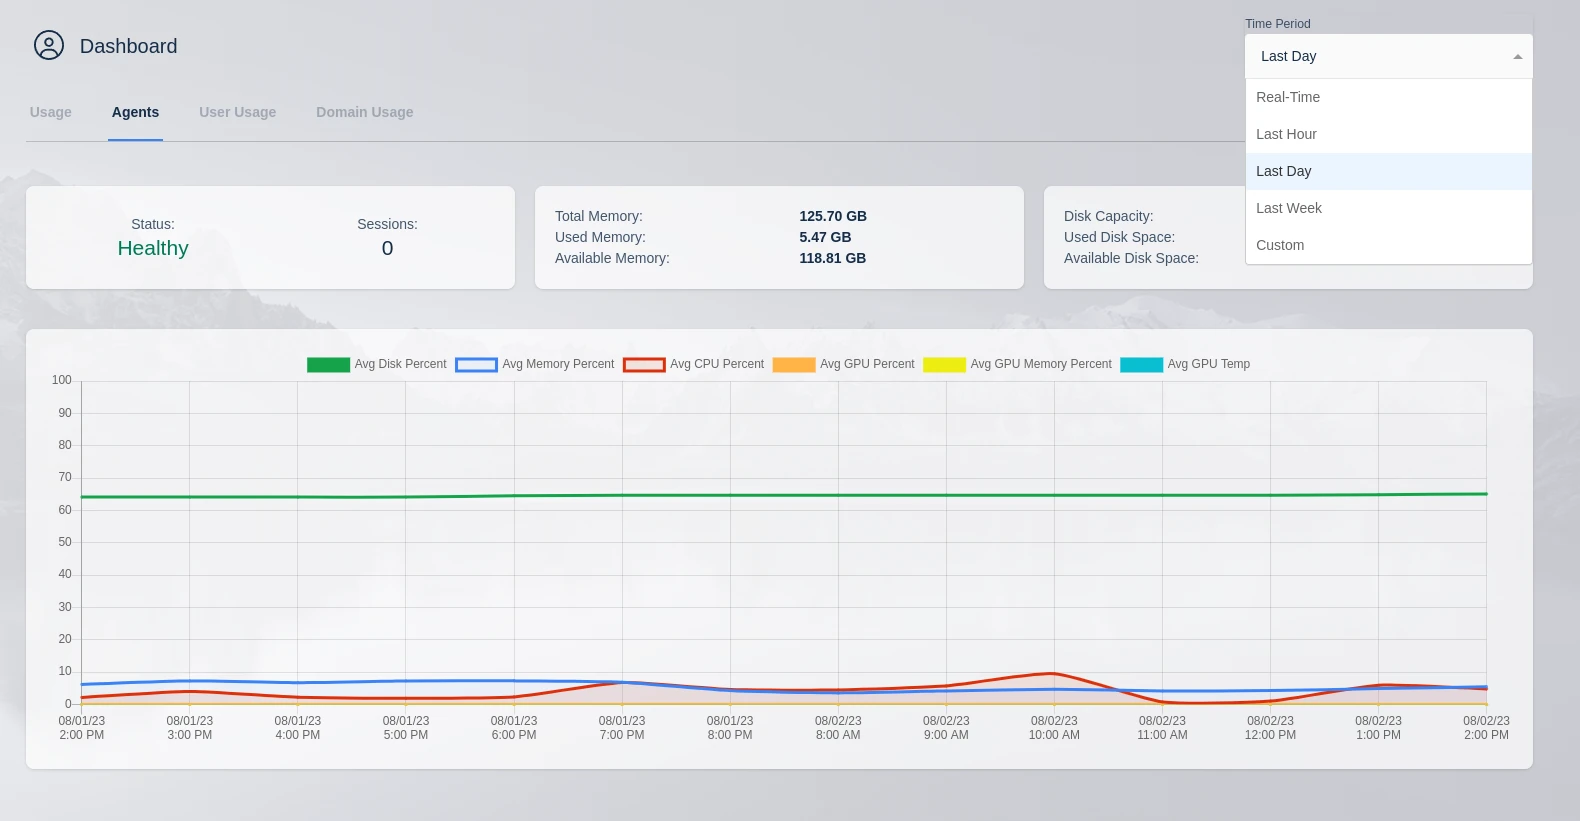
Report Options
The Real-Time option will display the last hour of data and refresh the data every five minutes. this is the only option with automatic refresh enabled.
Custom will open a custom time selection menu that allows specific time frames and auto refresh times to be selected. Select custom from the Time Period dropdown and configure the time period needed in the pop up.
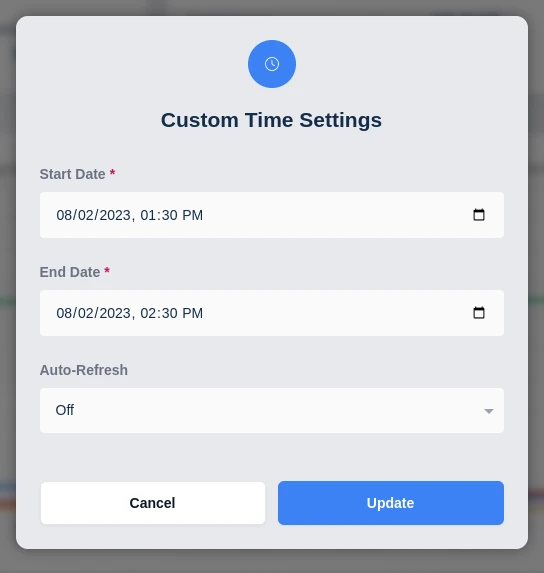
Custom Time Range
Logging Dashboard
The logging dashboard displays logs collected from the entire application. These can be searched separately and split up by process or host.
Basic log options are logging level, limit, which is the amount of logs returned, and Time, which is in minutes from the current time.
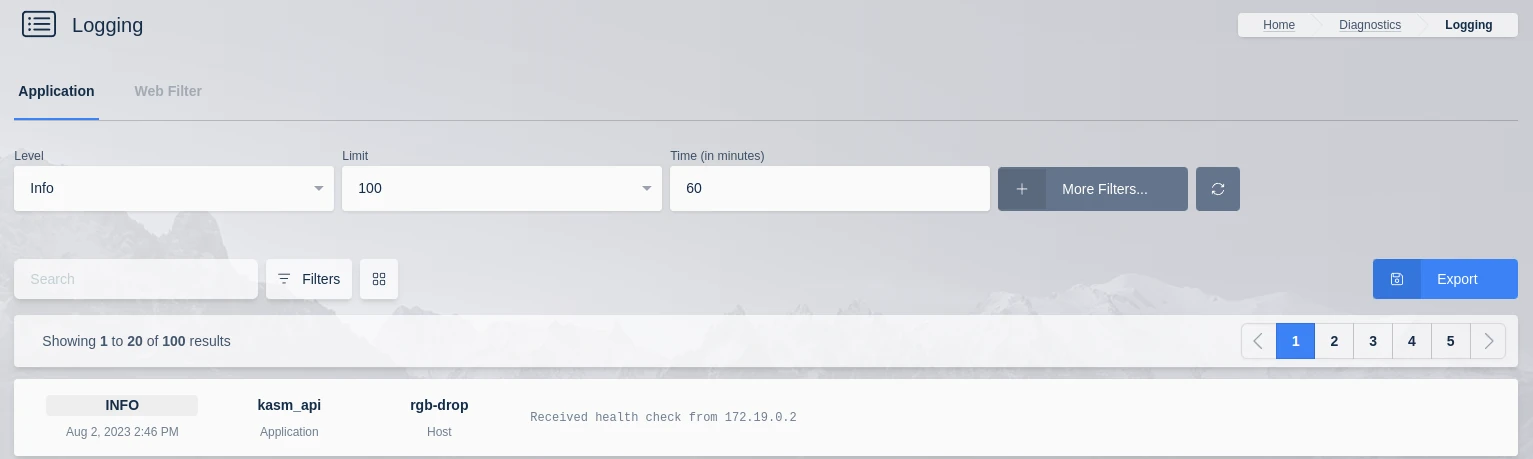
Default Log Options
Selecting the more filters option will display advanced log filters. The time selection will be set by custom start and end dates and the logs can be filtered by application, process and host. The logs may also be filtered using a username or message. i.e. putting “destroyed” in the search message box will return the logs of the destroyed sessions.
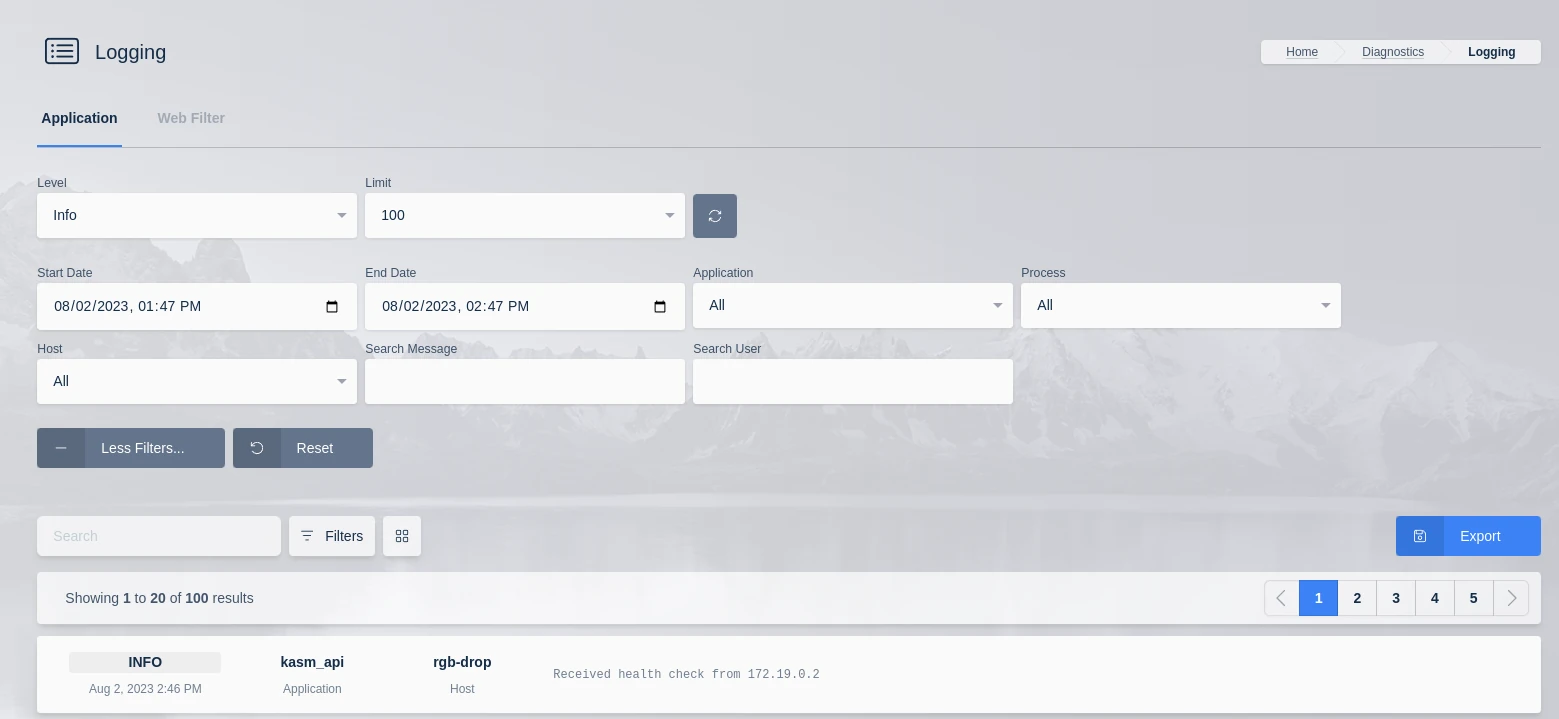
Advanced Log Options
You can also click on a single entry to get more options. If you click on the Export button you will get options to provide context for the item you have selected. The details will be zipped up into an AES256 encrypted zip file with a password of your choosing, that you will need to provide in order to extract, and will include up to 3 files.
export.jsonThis includes the log entry selected, the options chosen and the username.context.jsonAll the log entries (including the selected entry) in the time frame chosen.system_info.jsonThis is an optional file that is only included if the option is checked when exporting
As the zip file utilizes AES256 encryption, a utility such as 7zip is needed to extract the data. This is because many zip utilities built into operating systems like Windows and MacOS do not support AES256 for zip files.
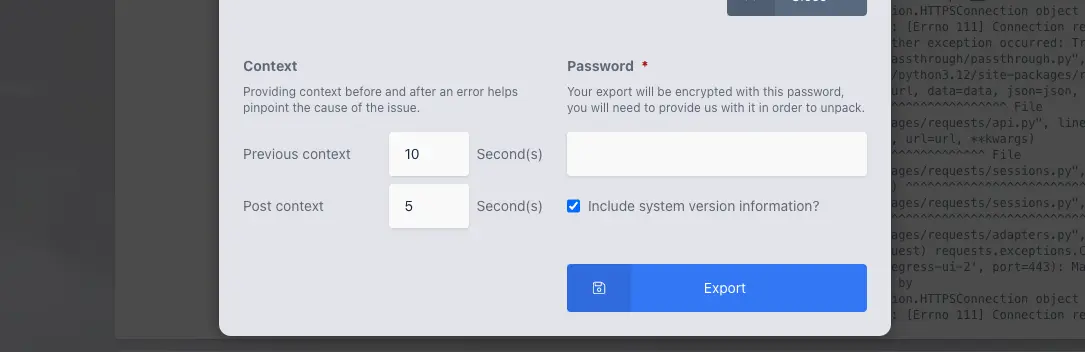
Context options for exporting
File Based Logs
Each role service emits a set of enriched json formatted logs that can be ingested into a SIEM solution of choice.
/opt/kasm/current/log/agent_json.log/opt/kasm/current/log/api_server_json.log/opt/kasm/current/log/manager_api_server_json.log/opt/kasm/current/log/web_filter_access_json.log/opt/kasm/current/log/share_json.log/opt/kasm/current/log/nginx/access_json.log
Metrics
Important application log events will include an attribute metric_name. This message is likely something
helpful that can be used for visualization and analysis. A few examples include:
provision.createprovision.destroyprovision.cast.createaccount.login.successfulprovision.destroyaccount.login.failed_invalid_passwordaccount.login.failed_ldap_errorscaling.status.resourcesscaling.provider.aws.status
Many metric logs contain additional data useful for analysis. Administrators can inspect the logs for details.
Common Attributes
Where possible and applicable, the application logs will emit additional attributes Administrators may find useful for context.
messagelevelnamerequest_ipuser_agentserver_id(Agent ID)kasm_user_idkasm_user_namekasm_image_idkasm_image_namekasm_image_friendly_namekasm_id